Know your numbers right now
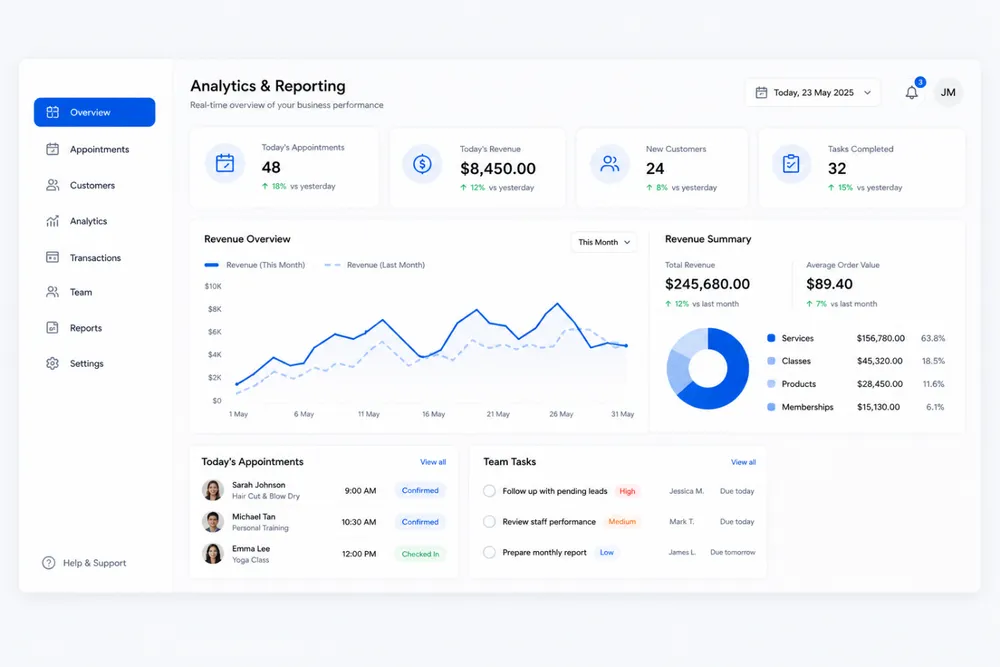
BooknGo’s analytics dashboard updates your KPIs the moment a booking is made, a payment is collected, or a customer checks in.
Revenue, bookings, no-show rate, staff utilisation, and customer trends — all visible from one dashboard, in real time. No spreadsheets, no month-end surprises.
By the time you know how last month went, it’s too late to act
Most owners piece together performance from bank statements, spreadsheets, and gut feeling — after the month has ended, while small problems compound silently.
BooknGo shows you what’s happening right now, so you can spot problems while they’re still small and make decisions today.
KPIs that drive better decisions
Revenue at a glance
Today, this week, and this month — updated in real time with trend indicators vs previous periods.
Booking & no-show rate
Track bookings, cancellations, and no-show percentage live, and act before they cost you revenue.
Staff utilisation
See how fully booked each staff member is, and spot under- or over-loaded staff from live data.
Service performance
Services ranked by revenue, bookings, and demand so you know what to promote.
Customer retention
New vs returning, visit frequency, and who’s at risk of churning — reach out before they disengage.
Reports in seconds
Pick a report and date range, then export to Excel or PDF for your accountant or investors.
Ready the moment you log in
- No setup required. The dashboard populates automatically from your bookings and payments from day one.
- Compare periods instantly. This week vs last, this month vs last — trend arrows show what’s improving or declining at a glance.
- Multi-location KPIs. See all branches on one dashboard or drill into a location to compare performance side by side.
Frequently Asked Questions
What KPIs can I see on the dashboard?
Revenue (today/week/month), bookings, cancellations, no-show rate, staff utilisation, service rankings, and retention — all in real time.
Does the dashboard update in real time?
Yes. Every booking, payment, check-in, and cancellation updates your metrics instantly — always live data.
Can I export data for my accountant?
Yes. Export sales reports, transactions, and customer data to Excel or PDF in seconds.
Who on my team can access the dashboard?
Access is by role — owners see everything, branch managers their location, and staff their own bookings and metrics.
Can I compare performance across locations?
Yes. View all locations combined or filter to one branch and compare revenue, bookings, and utilisation side by side.
Make decisions based on what’s happening now
See exactly how your business is performing today — track KPIs in real time, generate reports in seconds, and give your team the data they need.
Request Demo